Data Analytics Competition Final Project
Requirements and Evaluation
- Participants are required to thoroughly read the case introduction, fulfill the basic requirements, and are encouraged to go beyond the basics by incorporating additional analysis.
- Participants in the Python Data Analysis category and the Excel Data Analysis category should use respective tools to complete the case requirements. The analysis report should be crafted using Microsoft Word, with a focus on incorporating both graphics and text.
- The judging panel will evaluate the submitted analysis reports based on content (completeness of the project, data visualization, innovation, etc.) and presentation (format, layout, etc.).
Project Introduction
Dataset Name: Taipei Real Estate Dataset.xlsx
Dataset Overview
The Taipei Real Estate dataset comprises property information from Xindian District, New Taipei City. The dataset is in xlsx format, containing a total of 414 records. “NA” denotes missing data. It includes 6 explanatory variables:
X1 = Transaction Year-Month (e.g., 2013.250 represents March 2013, 2013.500 represents June 2013, and so on)
X2 = Age of the Property (in years)
X3 = Distance to the Nearest Bus Stop (in meters)
X4 = Number of Nearby Convenience Stores (integer)
X5 = Geographic Latitude Coordinates (in degrees)
X6 = Geographic Longitude Coordinates (in degrees)
The response variable: Y = Unit Area Price (price per ping, measured in New Taiwan Dollars, where 1 ping = 3.3 square meters)
Outline of Analysis Report
Project overview, analysis objectives, summary of methods used, results analysis, conclusions, etc. The analysis report must include the basic requirements, while participants are encouraged to add their own analysis content beyond the basics.
Data cleaning
####Analyzing the Basic Structure of the Dataset
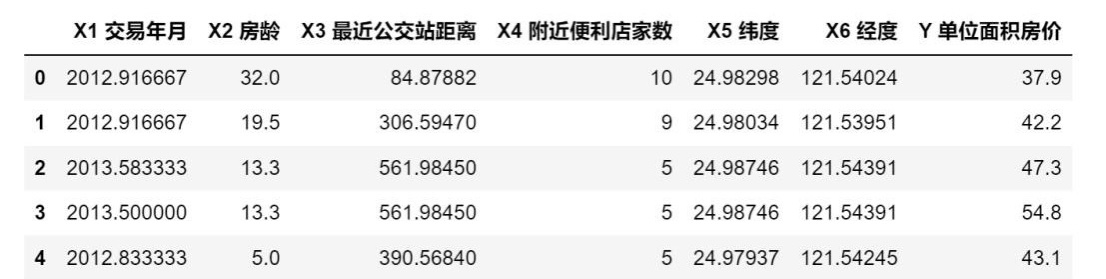
Querying and Outputting the First 5 and Last 5 Rows of Data
First 5 Rows:
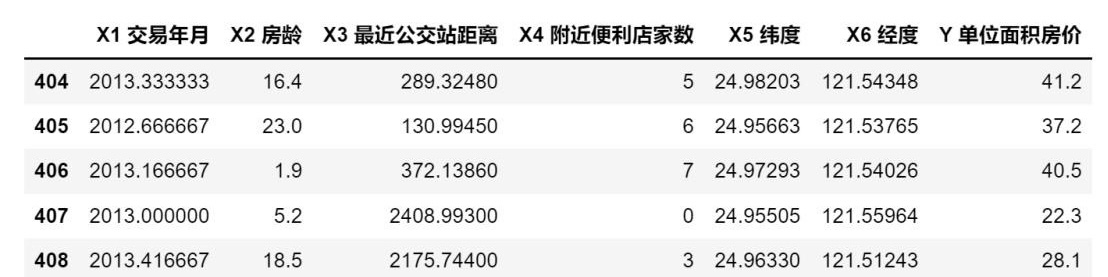
Last 5 Rows:
Identifies and outputs the types of all feature in the dataset:
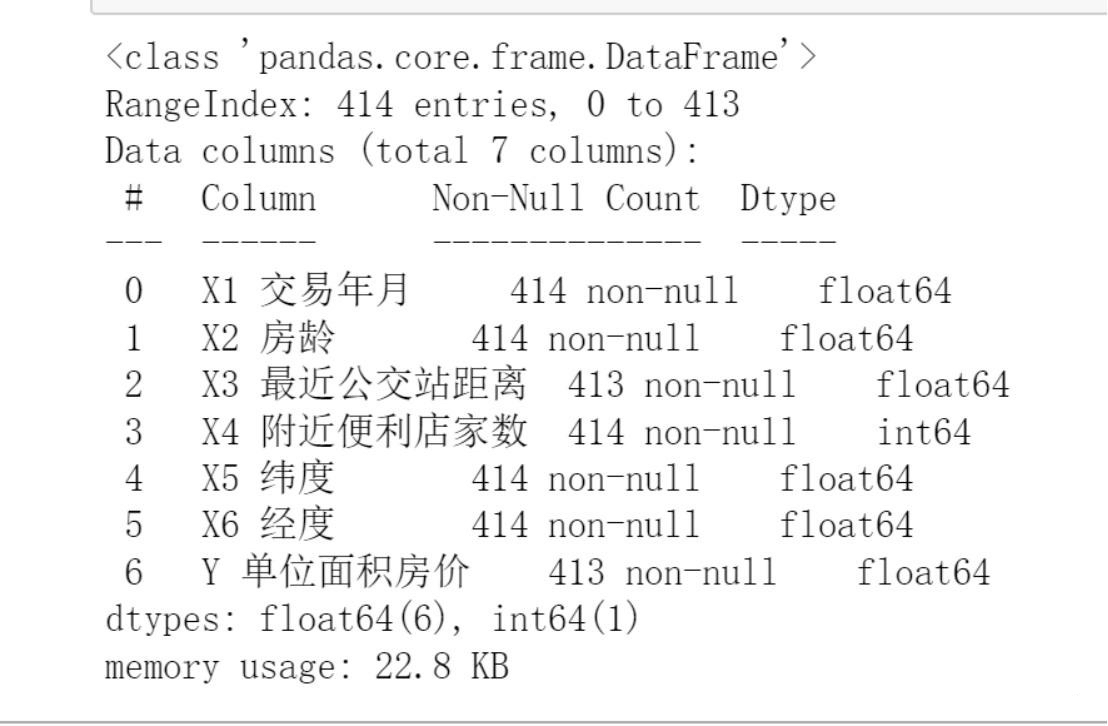
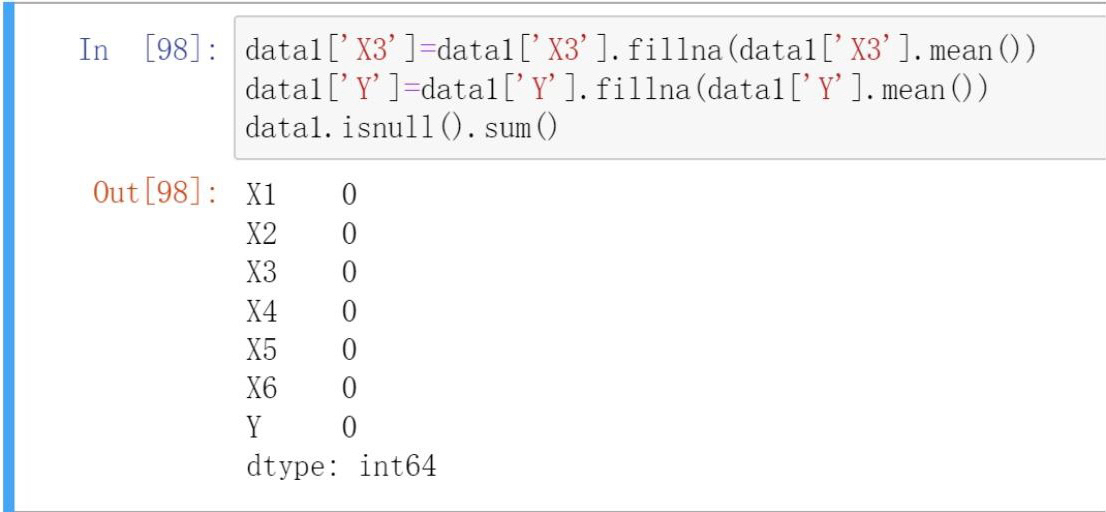
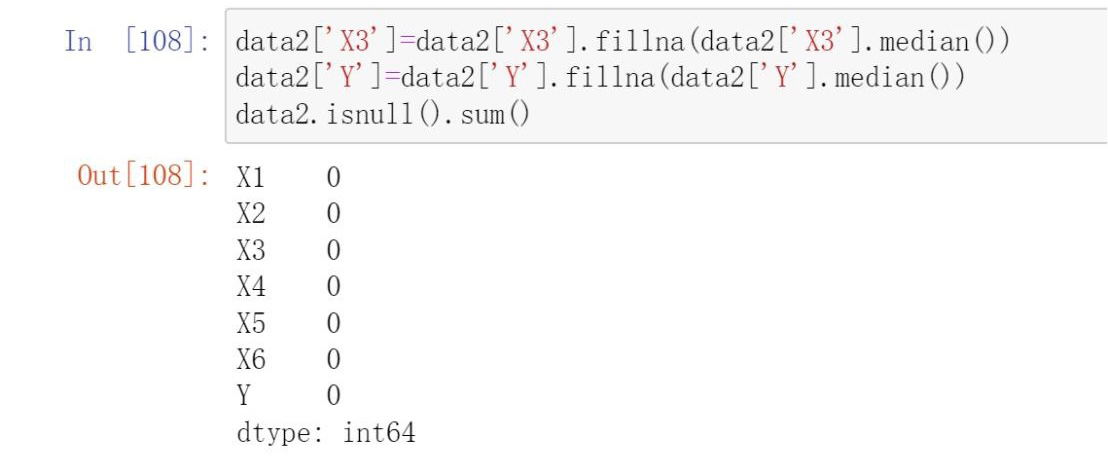
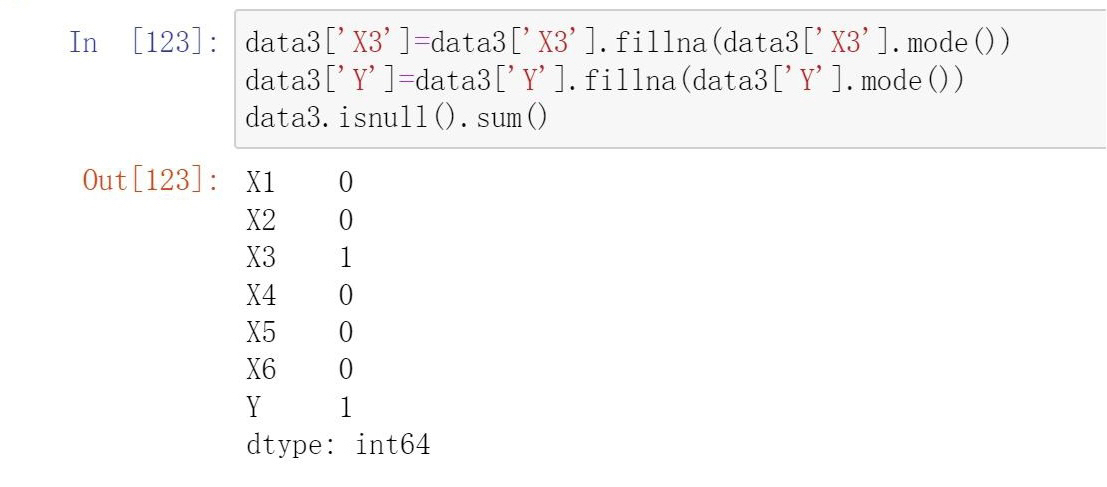
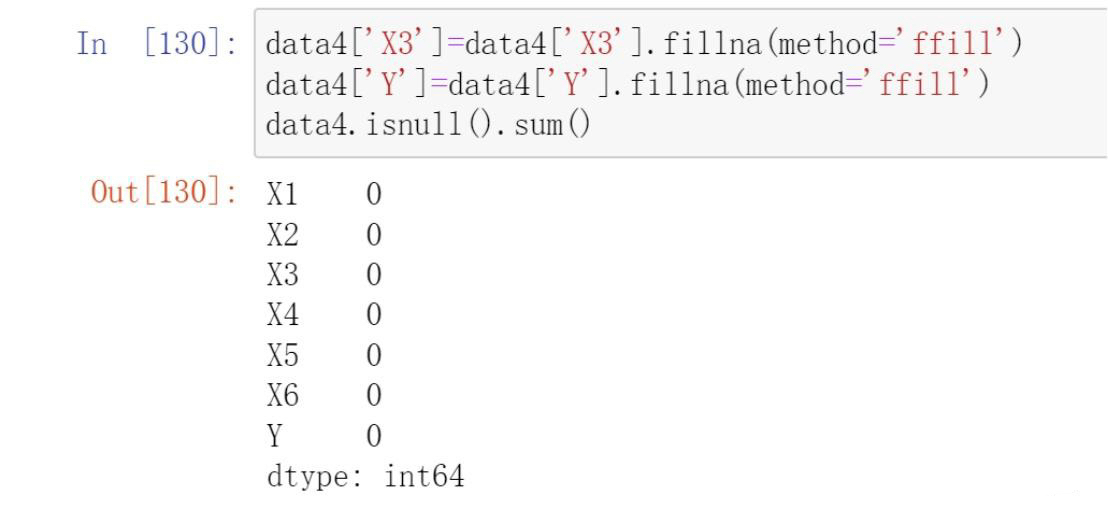
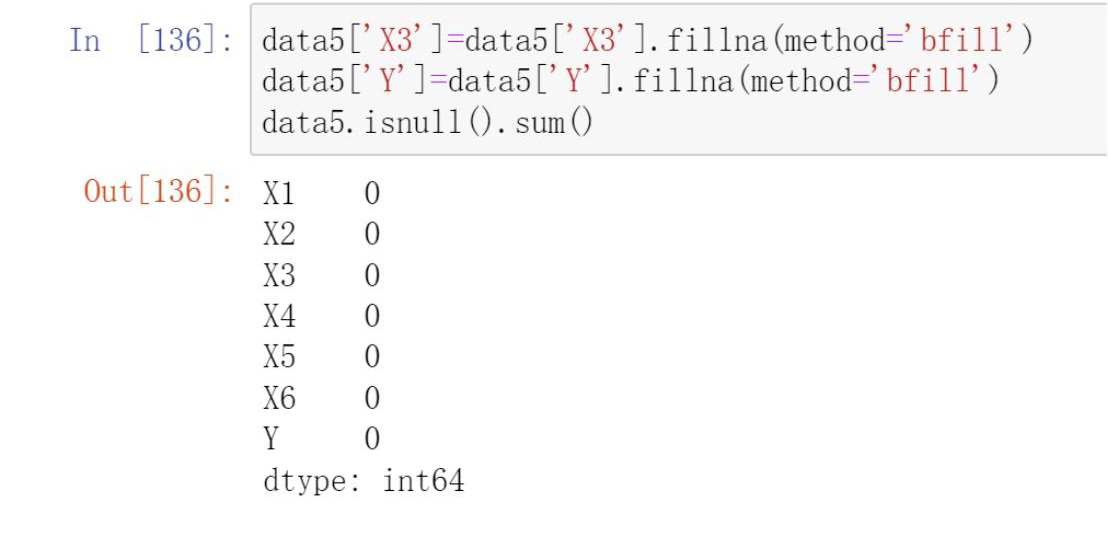
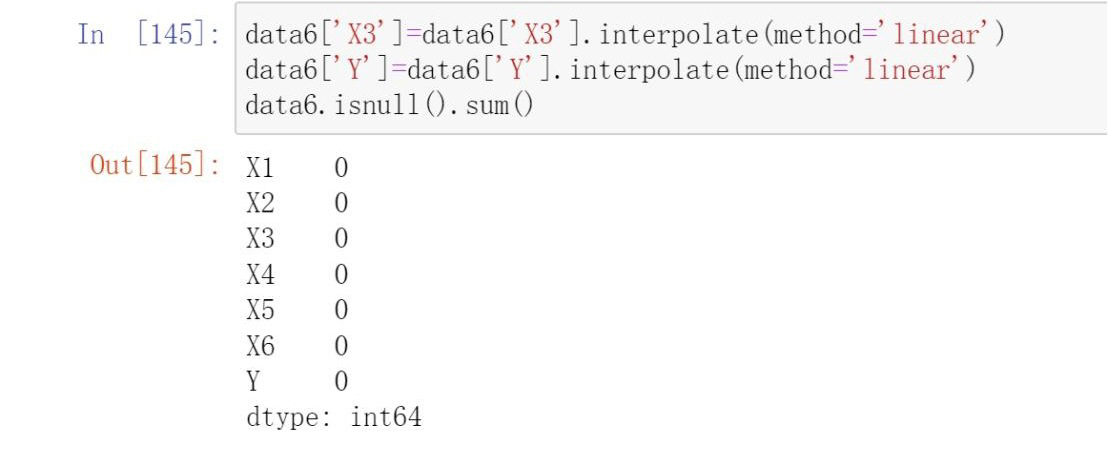
Missing Values
- Mean imputation
- Median imputation
- Mode imputation
- Forward fill
- Backward fill
- Pandas linear interpolation
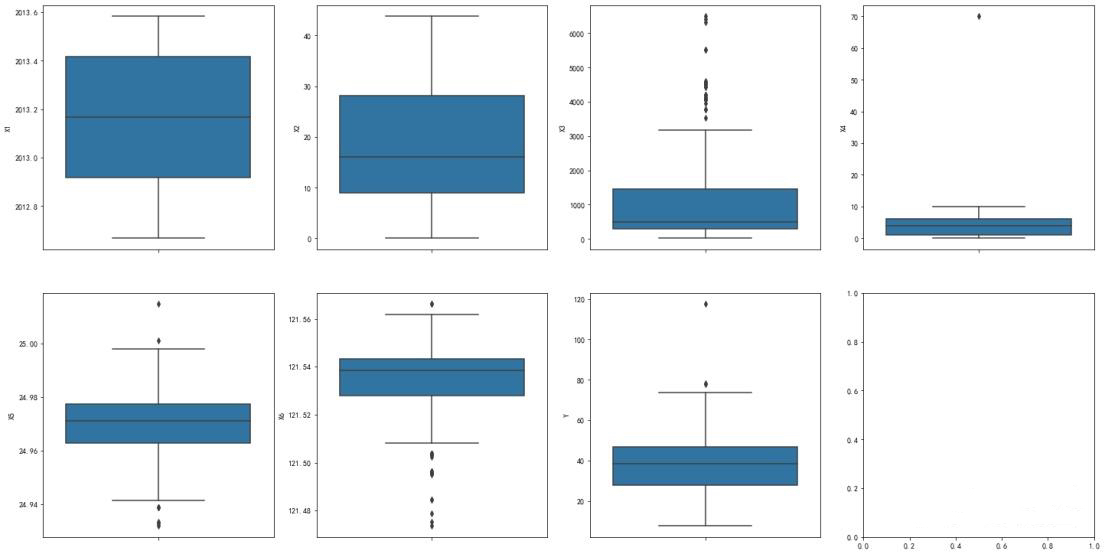
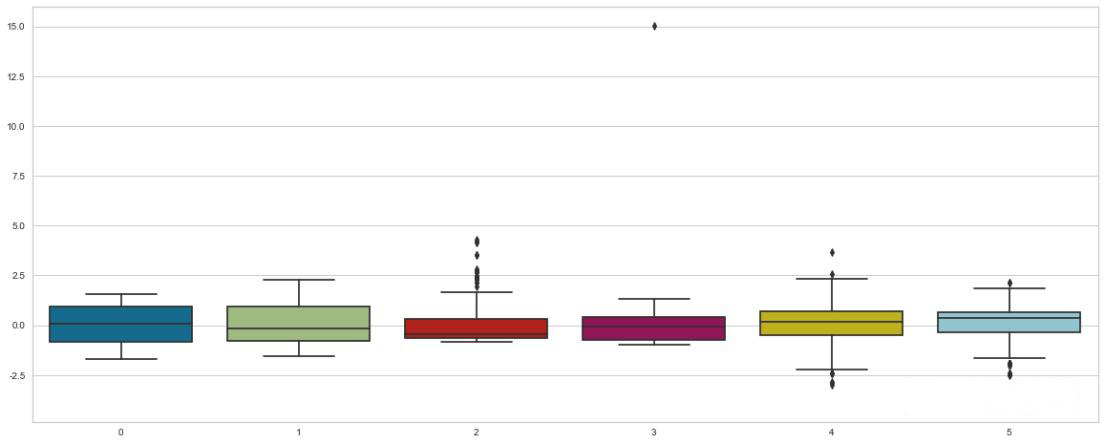
Outliers
Viewing data outliers:
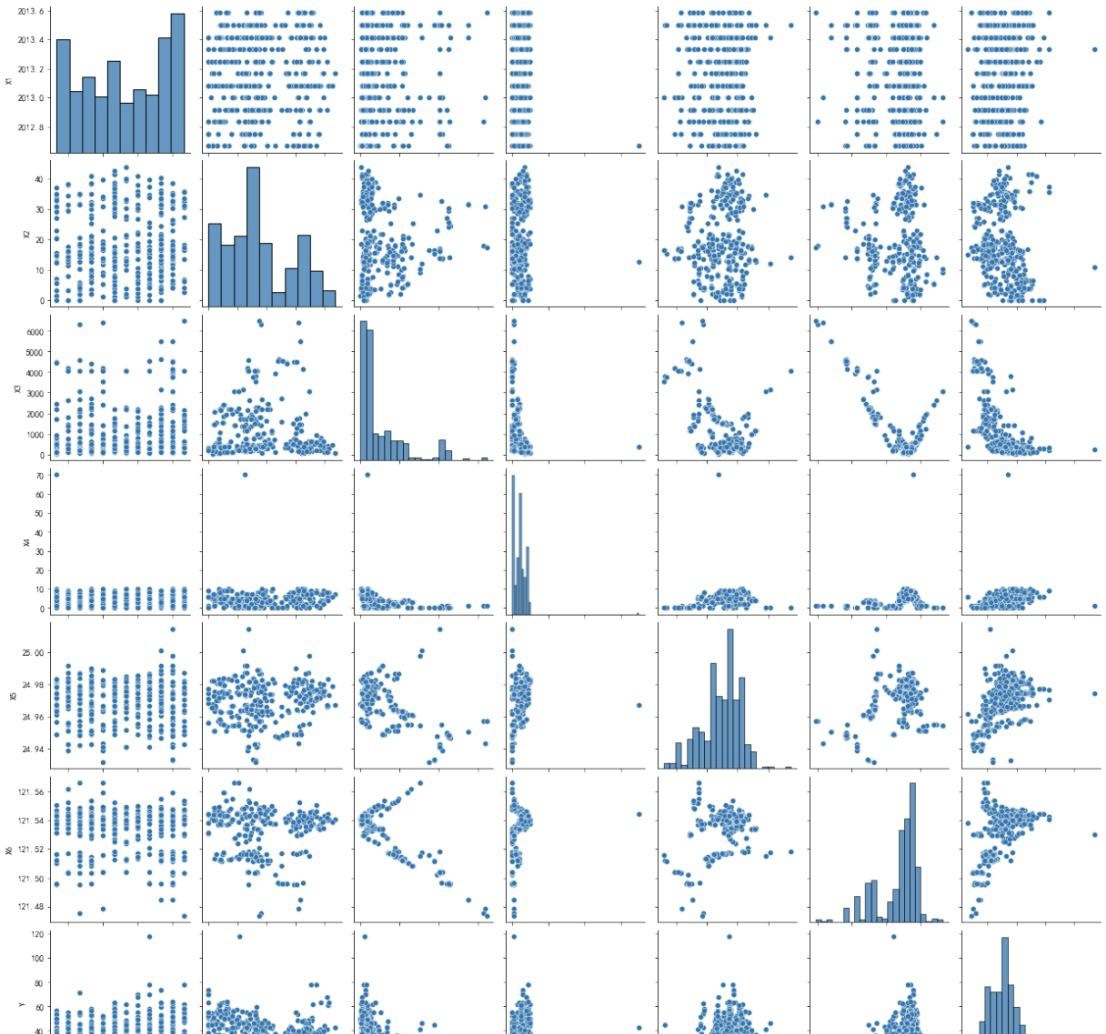
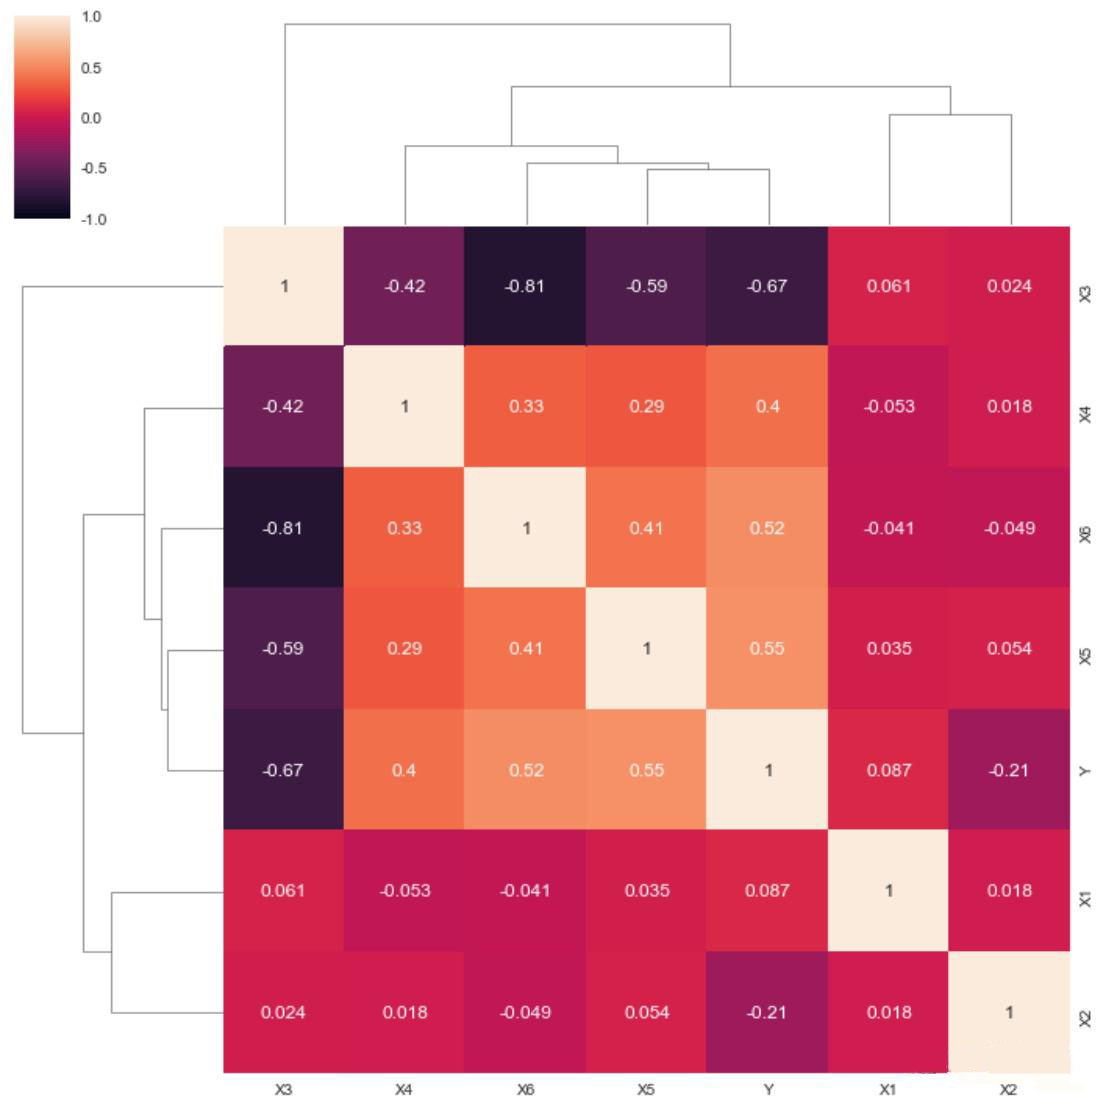
Next, conducting an initial visualization of the correlation within the structured data.
Data standardization
Utilizing the StandardScaler() method from sklearn to perform standardization on the data, resulting in data with a mean of 0 and a variance of 1 after processing.
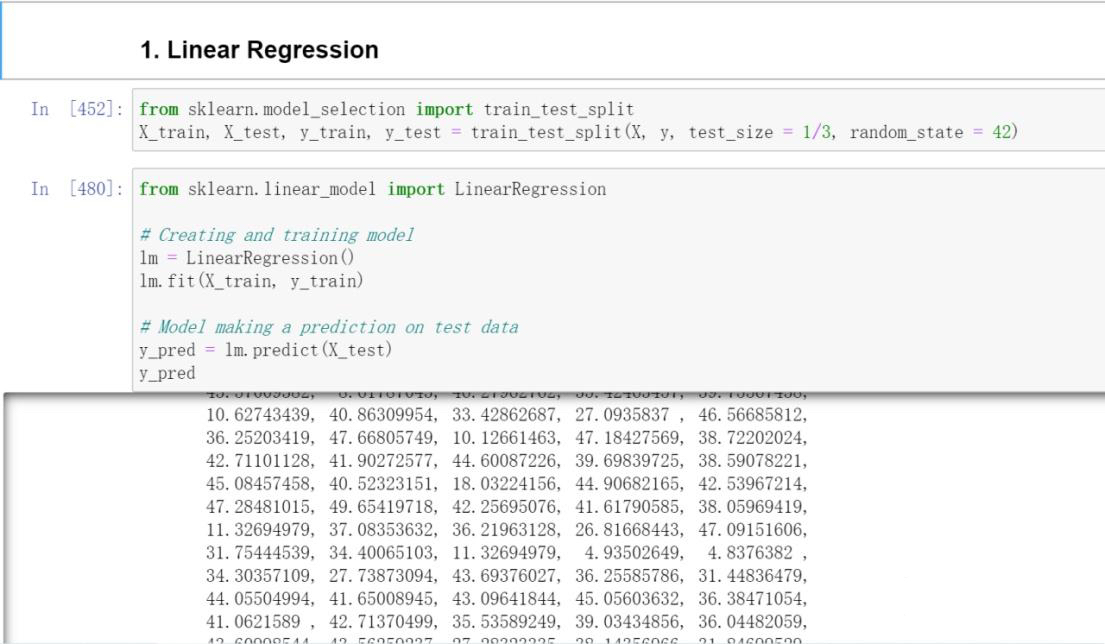
Constructing the model after splitting the data using K-fold Cross Validation
Analyzing Model Accuracy
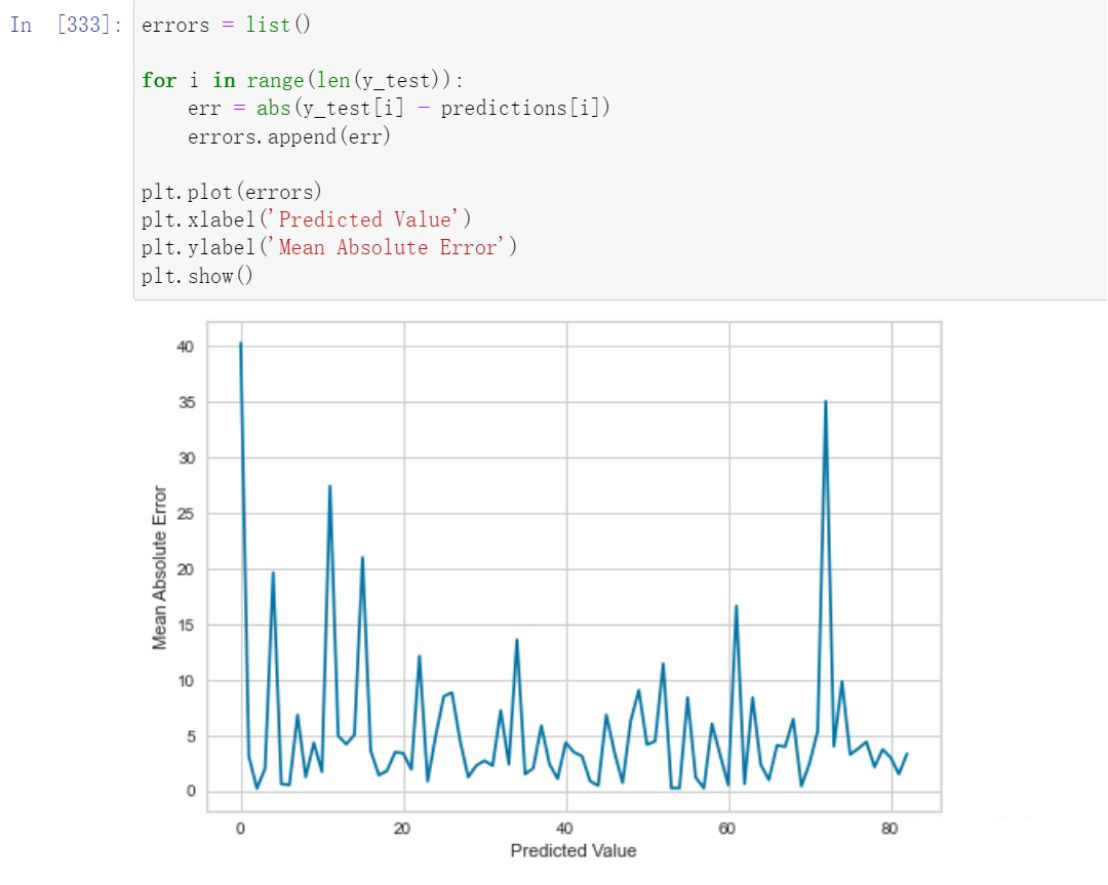
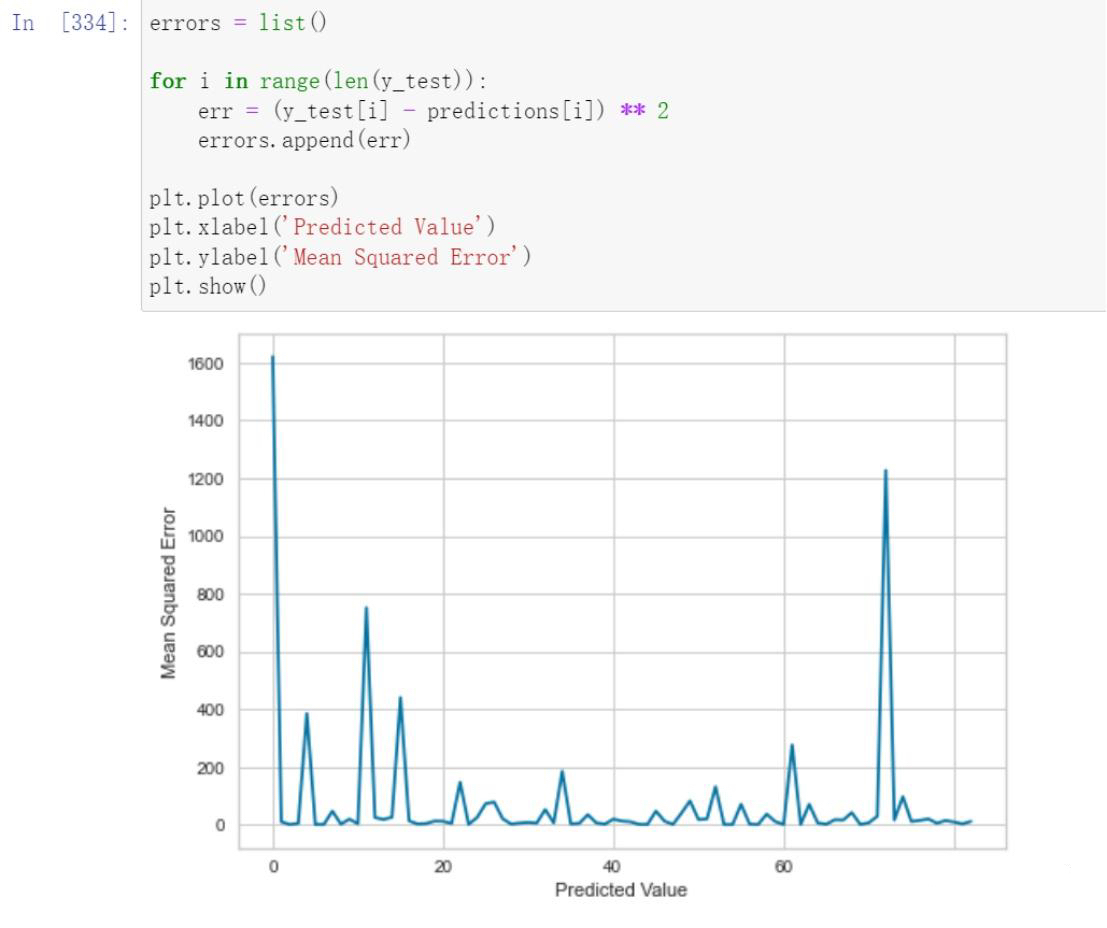
Error Analysis and Model Parameter Testing
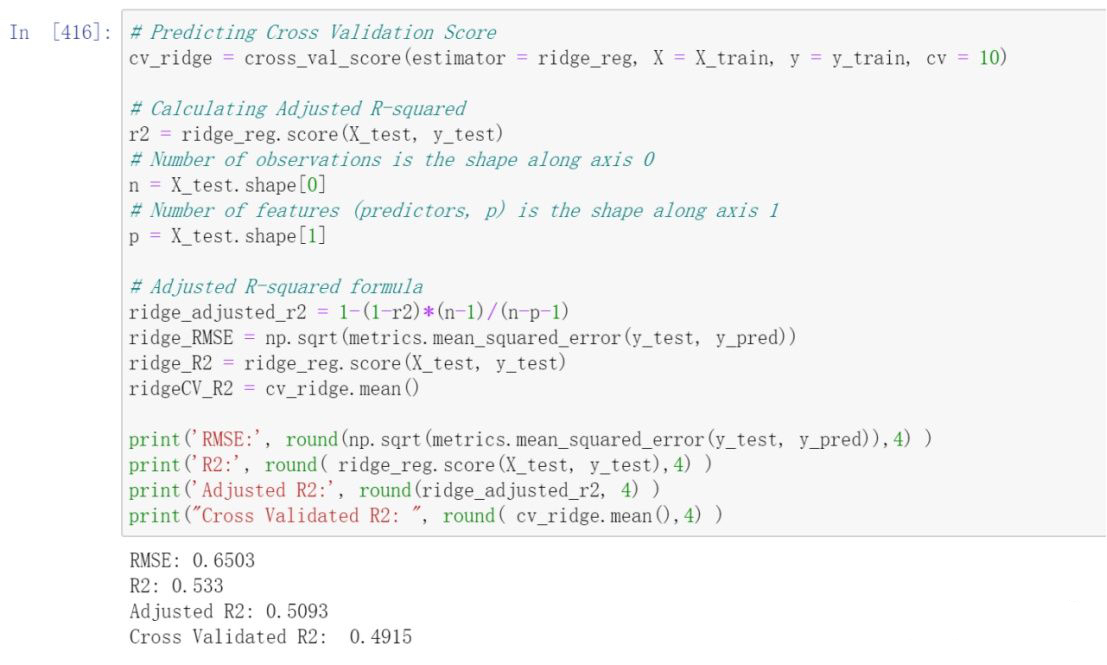
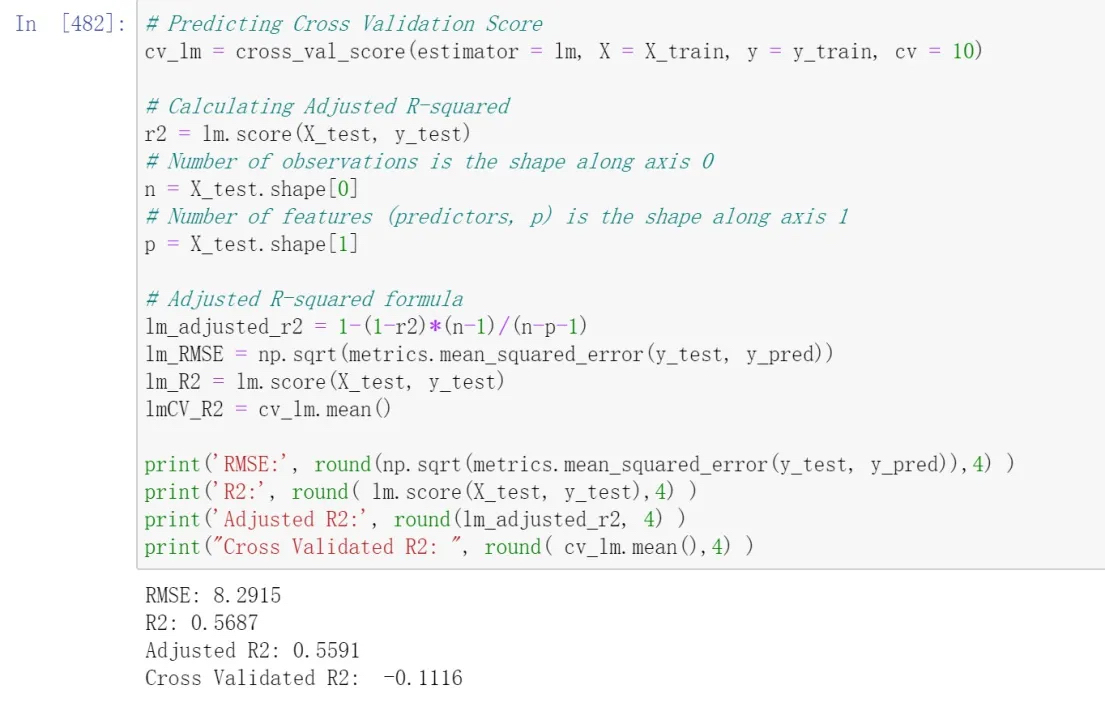
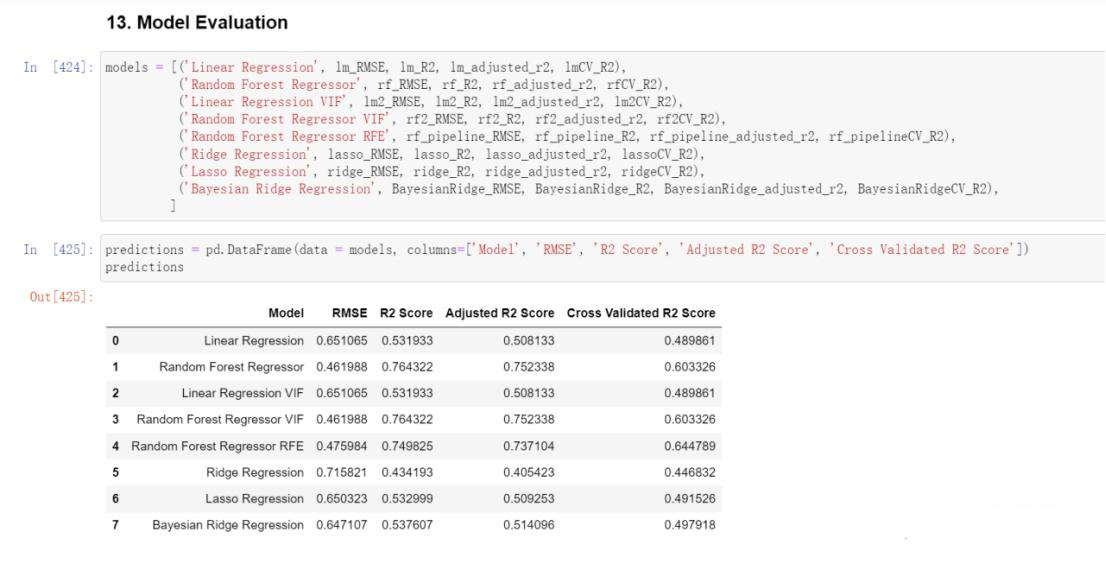
Model Evaluation
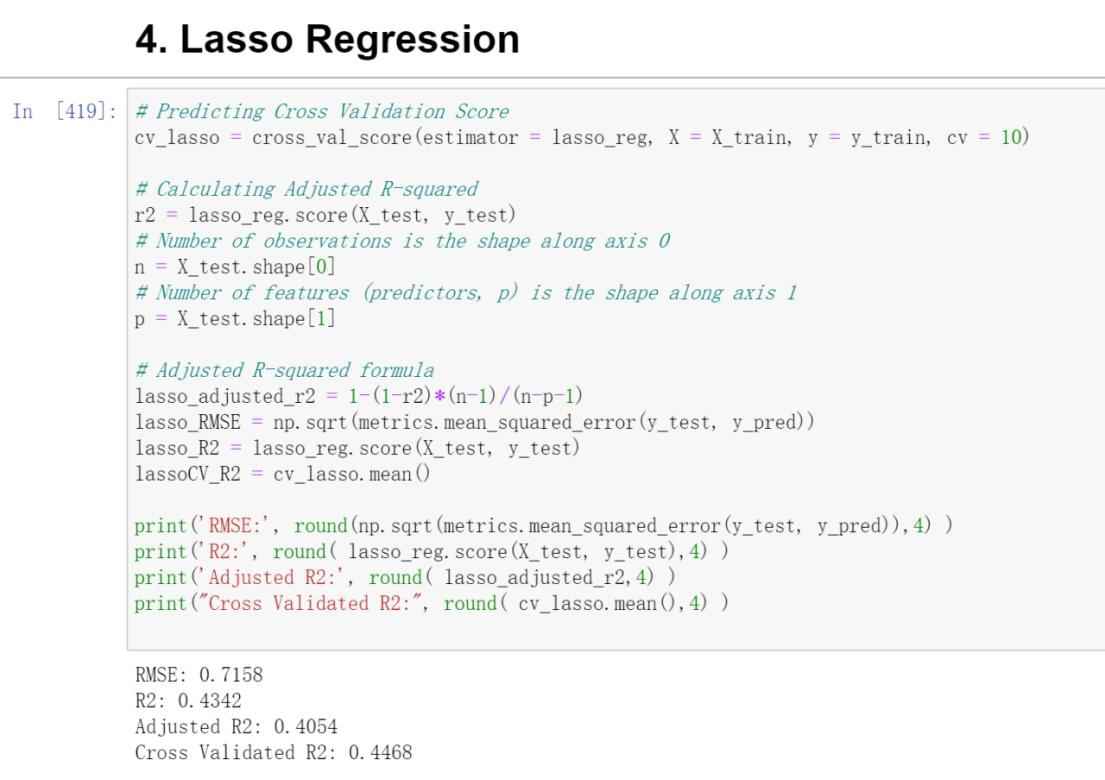
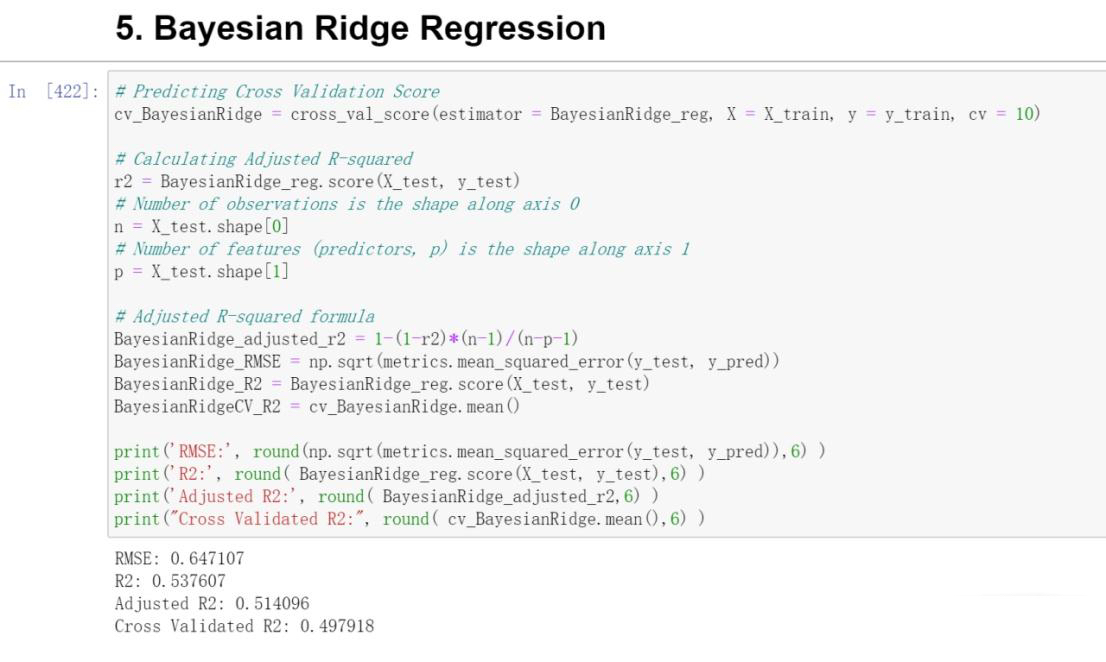
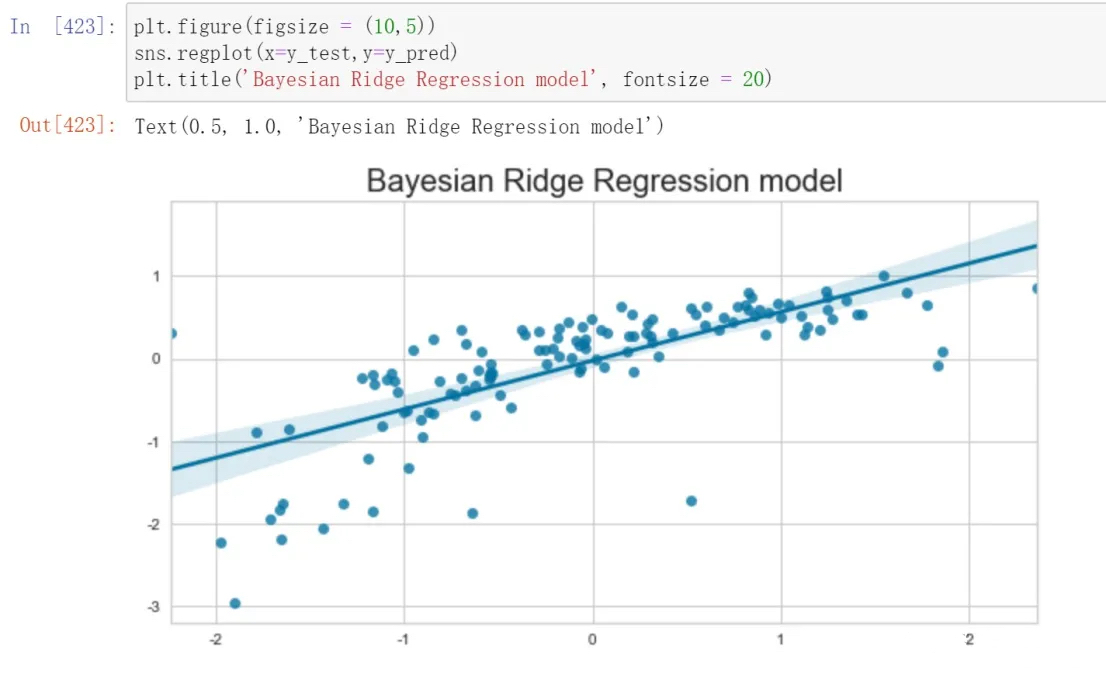
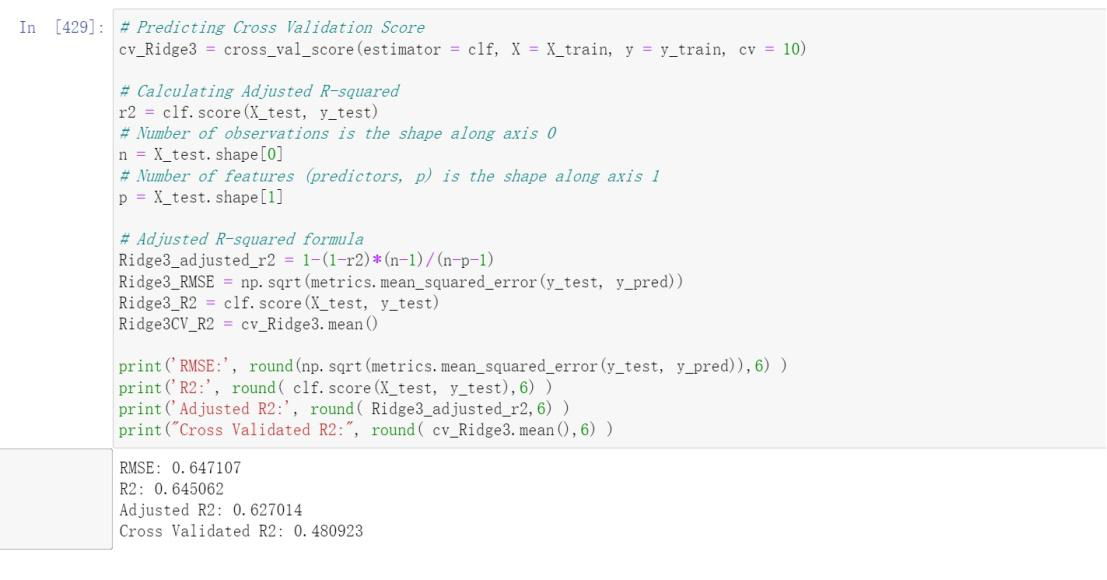
Results Analysis:
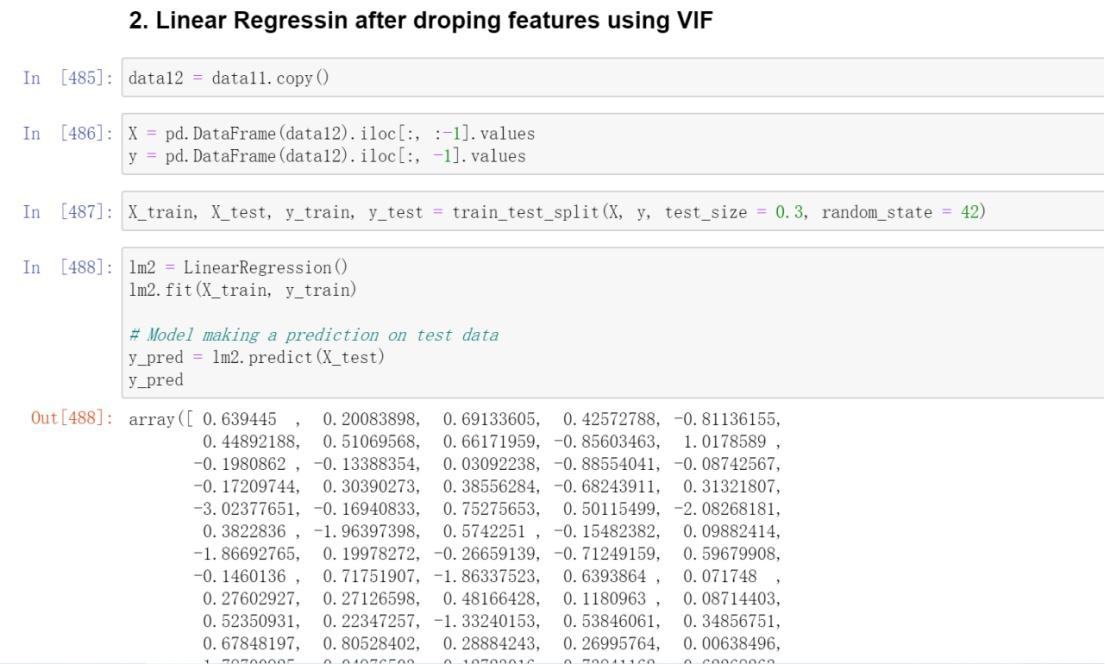
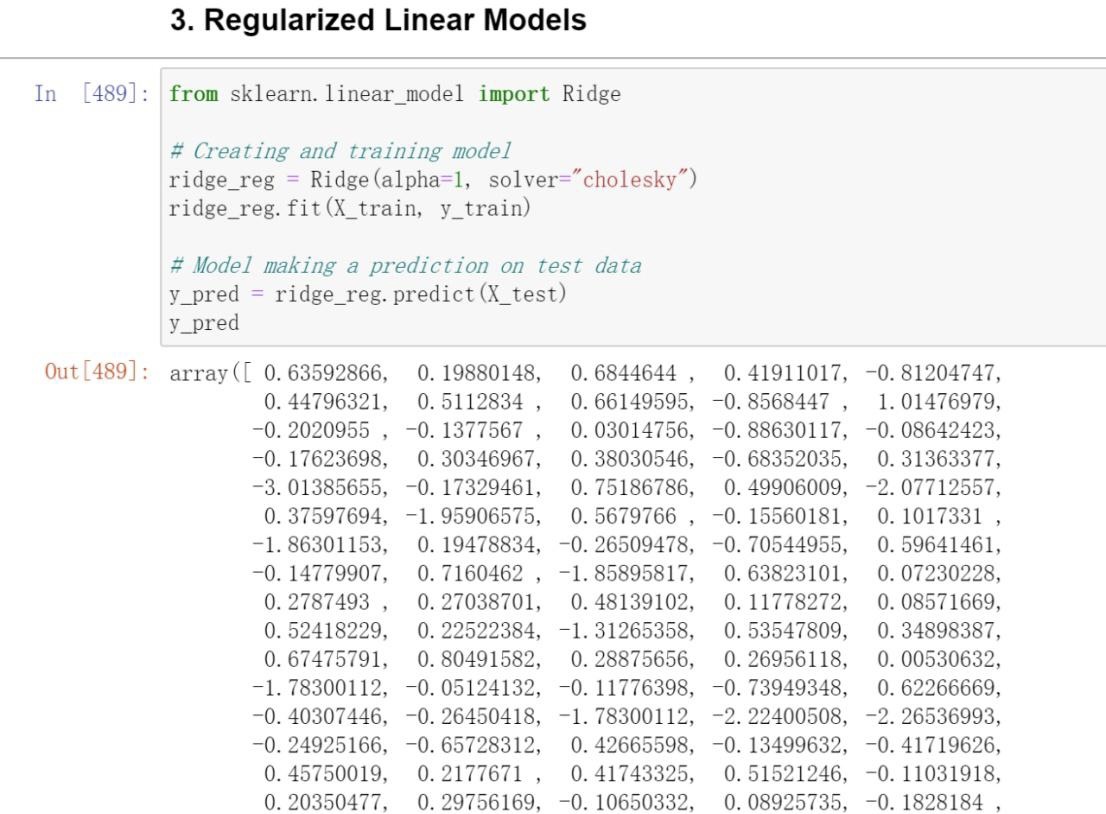
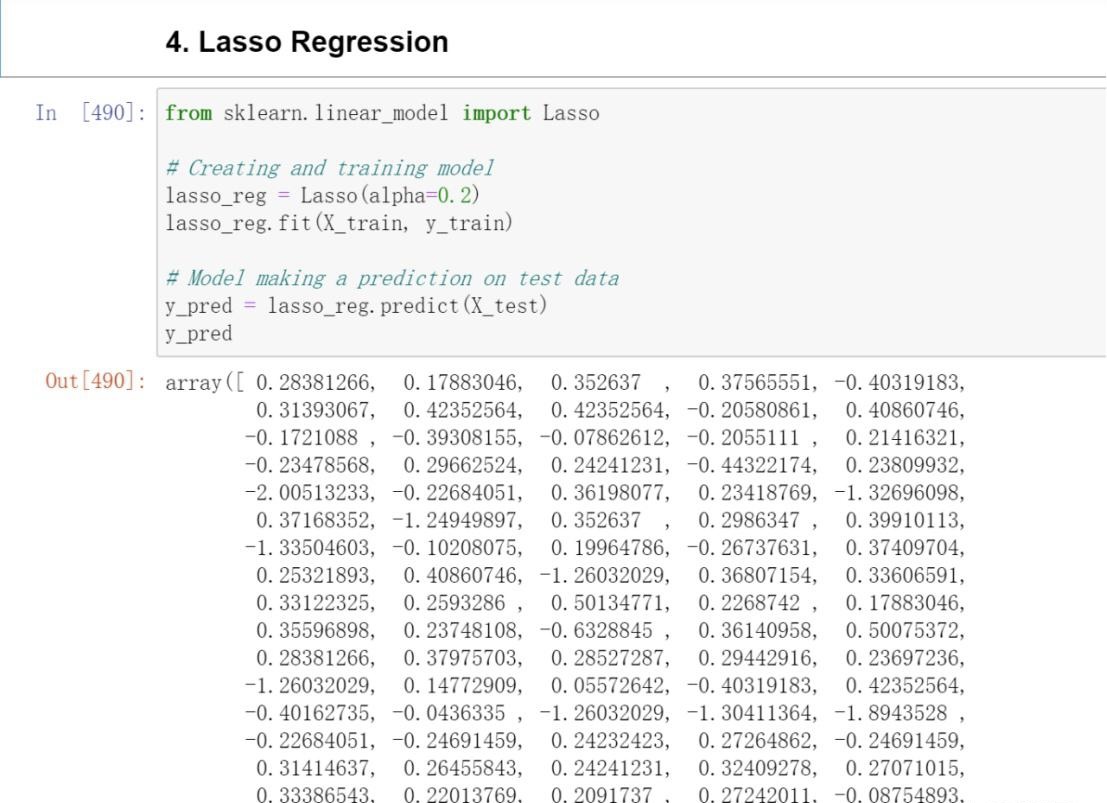
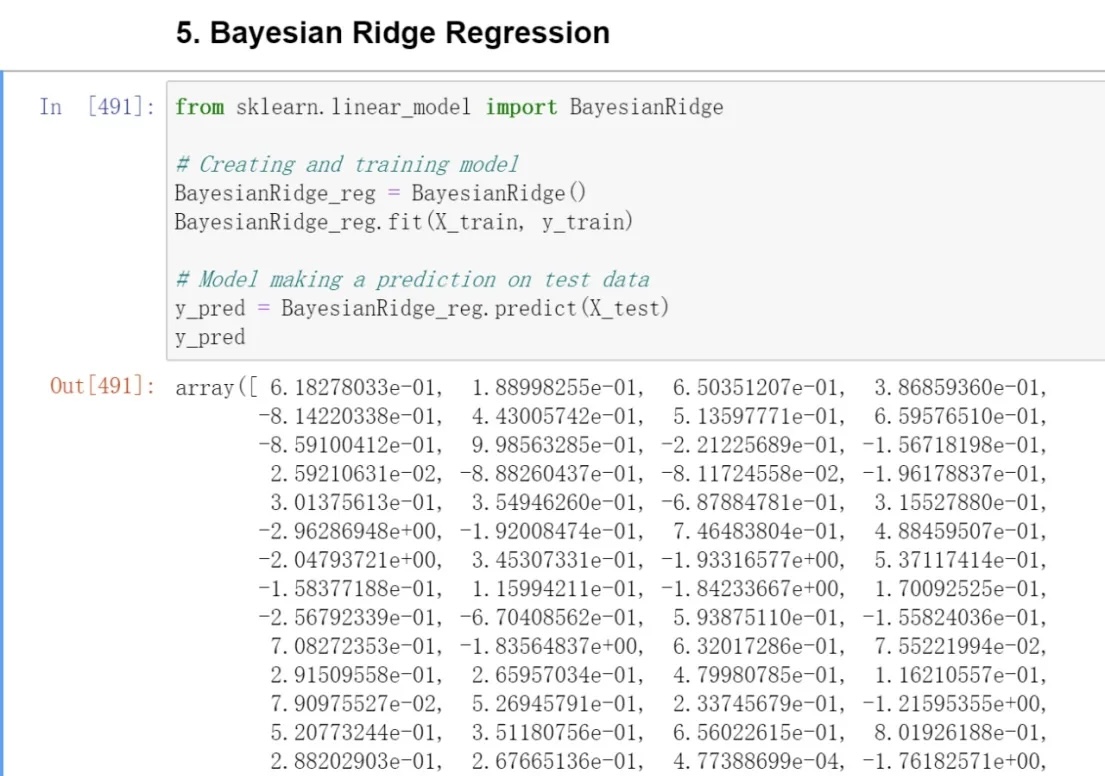
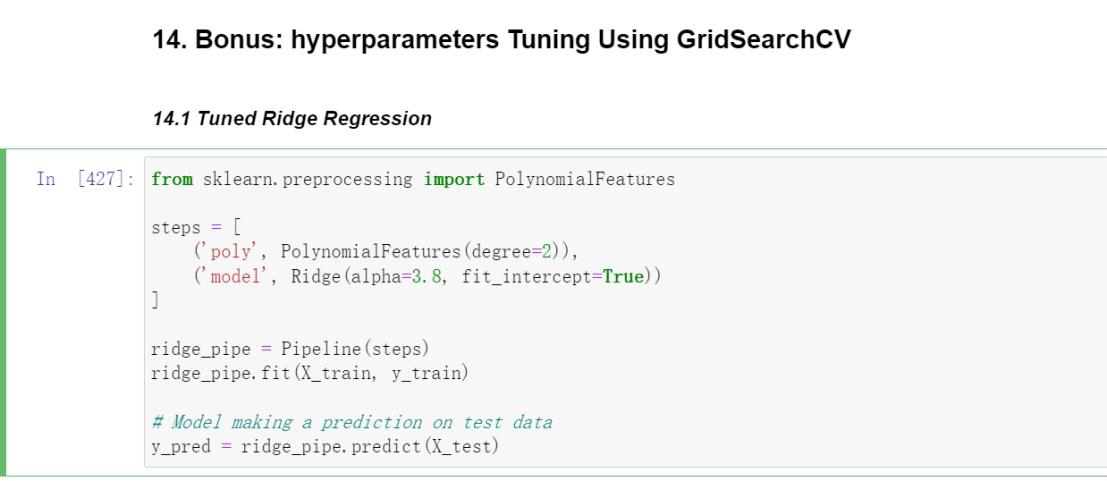
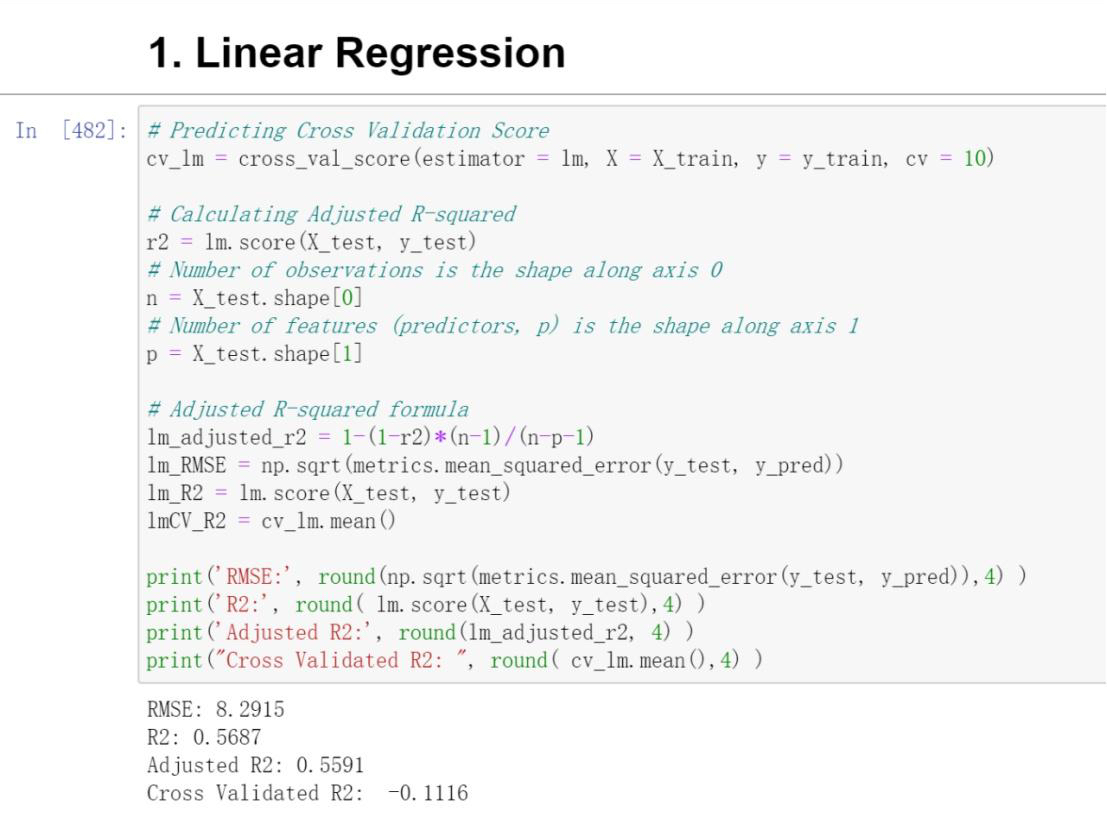
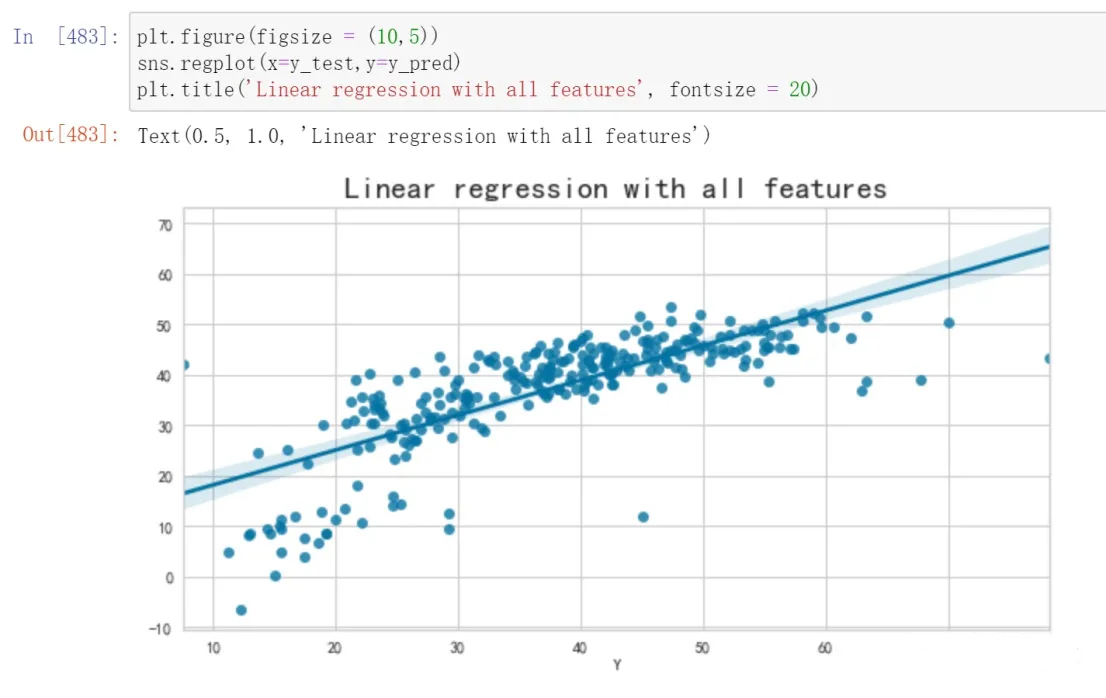
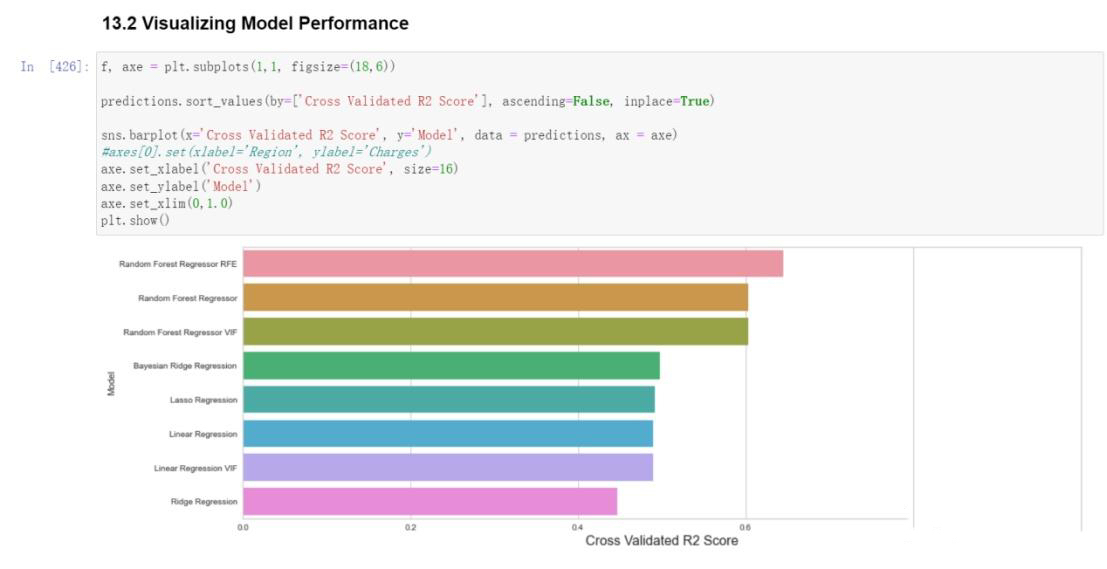
By comparing the results of various models including Linear Regression, Linear Regression after dropping features using VIF, Ridge Regression, Lasso Regression, Bayesian Ridge Regression, Random Forest Regressor, Linear Regression VIF, Random Forest Regressor VIF, and Random Forest Regressor RFE, a comparison was conducted using two-dimensional tables and bar charts depicting the outcomes of each model. It was observed that the Random Forest Regressor RFE exhibited the most favorable performance.